USDJPY 7/7 - S-T Range Trading Awaiting New Breakout catalyst...Since Japanese Prime Minister Takaichi took office and the market began speculating that the US Fed. will raise rates in 2026, the yen has been weakening. Major news sites have been promoting that the yen is at a 30-year high since 1990... Looking closely at the daily chart, USDJPY is still consolidating near the July 2024 high (around 162), not a confirmed breakout yet.
In the past 2 years, whenever the daily MACD showed divergence, USDJPY experienced a clear correction. Momentum has slowed, but the correction has yet to appear, as the market awaits a new catalyst...
What will the new catalyst be...?
Will the US Dollar Index strengthen again, breaking above 101.80? Two weeks ago, some investment banks reported three rate hikes this year. For the dollar to strengthen further, the market would need to speculate on more than three hikes by the Fed in 2026, which seems unlikely for now... Especially after the US/Iran situation eased, the chance of a reversal is higher...
Will the Bank of Japan intervene again? According to the IMF, Japan is a currency free convertibility country, and the BOJ still has two chances to intervene before November. Referring to the last intervention effect, it only pushed a 500-point adjustment. If they intervene again, how many points can they push down? The market usually discounts the second intervention, so this time a 300-point adjustment? It is believed this time they must act more aggressively, using more foreign reserves to be effective 🤔?
"Unknown" factors? Why say that 🤣 Just like the 2025 tariffs or the Iran situation earlier this year, these are items requiring careful planning. Planned items are known to some (based on market reactions over the past six months), but certainly not to general investors. I believe something will appear before the US midterm elections, so just wait...
Currently, USDJPY can only continue narrow range trading at high levels. Without new news, the trading range is between 158(1) and 163, operating within a consolidating triangle. USDJPY must break below the 150-day moving average to see a deeper correction.
Of course, a breakout upwards cannot be ruled out. If selling pressure above 163 clears and market momentum increases, USDJPY will retest new highs with a target of 166.5.
Start preparing, are you ready? Gold has entered a range-trading💡 Fundamental Effect :
- Gold has entered a range-trading phase as it factors in the potential impacts of the Federal Reserve meeting, possible interest rate cuts, and a correction in equity markets following news about Chinese AI model DeepSeek, according to Norman.
- On Monday, a sell-off in technology stocks triggered by DeepSeek news led investors to liquidate bullion to offset losses.
- With the Fed's first policy meeting of the year concluding today, investors are closely watching for signals about the direction of interest rates and insights from Chair Jerome Powell's speech.
- Trump has urged for lower interest rates, which conflicts with the Federal Reserve’s independent authority to set interest rate policies.
- Meanwhile, Trump remains committed to imposing tariffs on Canada and Mexico, following through on his earlier promises.
- These policies are considered inflationary, which may compel the Federal Reserve to maintain higher interest rates to counter rising price pressures.
💡 Summary
-Price is currently consolidating near $2757 with resistance at $2771-$2772.
-A break above $2772 could lead to further upside momentum.
-A break below the 200 EMA at $2756 might lead to a test of $2744.59,
signaling bearish continuation.
Main Analysis-
 Long
Long
 Long
Long
 Long
Long
 Long
Long
XAUUSD – Brian | H2 Technical AnalysisXAUUSD – Brian | H2 Technical Outlook – Consolidation & Range-Building Phase
After the recent sharp sell-off, gold is now transitioning into a consolidation phase on the H2 timeframe. The strong bearish impulse has slowed, and current price action suggests the market is shifting from directional movement into range-building and accumulation, rather than continuing lower immediately.
This type of behavior is typical after aggressive volatility, as the market reassesses value and balances supply and demand.
Market Structure & Current Behavior
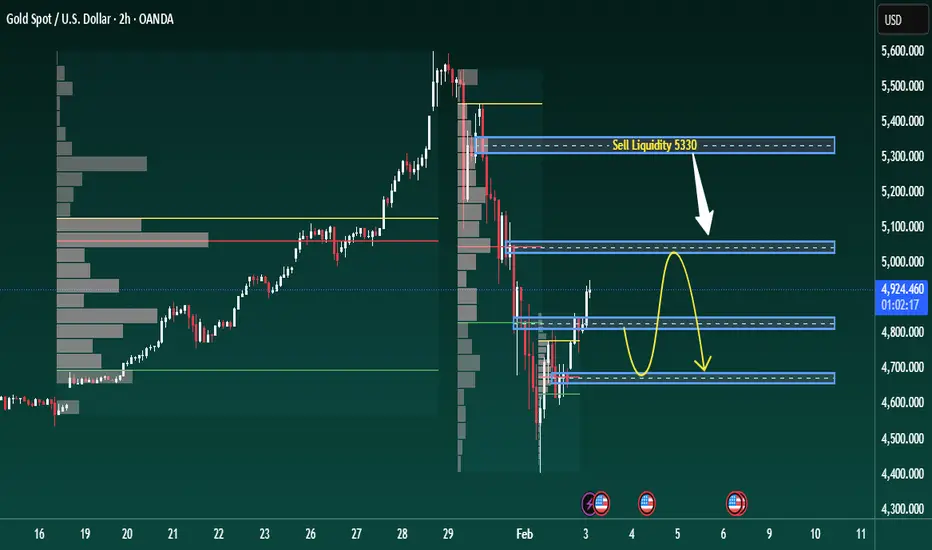
Structurally, price has broken below the prior bullish leg and is now trading within a defined value range:
Selling pressure has eased following the downside expansion.
Price is rotating around the VAL and lower value areas, indicating acceptance rather than rejection.
Momentum is no longer impulsive, pointing to sideways development rather than trend continuation.
As long as price remains inside this value range, range trading conditions dominate.
Key Value & Liquidity Zones Upper Resistance / Supply
Sell Liquidity: 5,330
Sell Zone POC: 5,045
These zones act as overhead supply where upside attempts may be capped during consolidation.
Lower Support / Demand
VAL zone
Buy scalping POC: 4,673
This lower area represents short-term demand, where downside moves are more likely to stall during the accumulation phase.
Intraday Expectation
For today’s session:
Primary expectation: Sideways consolidation within the established range
Price is likely to rotate between value extremes rather than trend strongly
Breakouts require clear acceptance above resistance or below support to shift bias
Until such acceptance occurs, patience and range awareness are more effective than directional conviction.
Key Takeaway
After strong volatility, markets often pause to rebuild structure. For now, gold appears to be absorbing orders and forming balance, making consolidation the higher-probability scenario.
Refer to the chart for highlighted value zones and projected range behavior.
✅ Follow the TradingView channel to receive early market structure updates and intraday outlooks.  Short
Short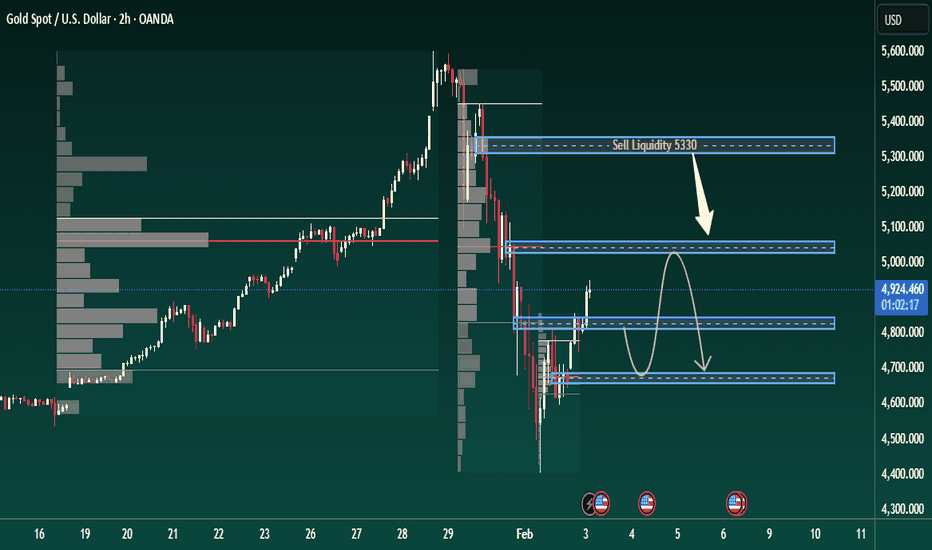
XAUUSD – H1 Sideways, Priority is Trading at Liquidity Zones...XAUUSD – H1 Sideways, Priority is Trading at Liquidity Zones
Gold is moving sideways on the H1 timeframe, with price fluctuating around the equilibrium zone and not choosing a clear direction yet.
In this condition, I avoid chasing trades in the middle of the range — instead, I only trade at the liquidity edges, where volume is higher and order-flow signals are clearer.
🎯 BUY Scenario – “Liquidity Buy” at the Lower Range
Buy: 4.191 – 4.194
SL: 4.187
TP: 4.212 – 4.235 – 4.260 – 4.290
The 4.191–4.194 zone is a Liquidity Buy area:
It aligns with the most recent sweep low.
It sits near a thick volume cluster showing strong absorption of sell orders earlier.
If price dips into this zone, I prefer buying back toward the upper boundary of the range, taking partial profits from 4.212 up to 4.26x.
This setup follows the idea of catching the defensive buy flow that is protecting the bottom of the accumulation zone.
🔁 SELL Scenario – Sell POC at Upper Range 4.237–4.240
Sell: 4.237 – 4.240
SL: 4.245
TP: 4.220 – 4.202 – 4.180 – 4.155
The 4.237–4.240 zone is a Sell POC / supply region:
Heavy volume sitting at the top.
Confluence with the current range high.
Price has previously rejected several times from this region.
If price returns to this zone, I prefer selling down toward the mid and lower range.
SL is kept tight above 4.245 to avoid being caught by a genuine breakout.
1️⃣ Broader Context – Market Shock ≠ Market Collapse
2013 – Abenomics: BOJ’s extreme easing caused volatility, but no systemic crash.
2022–2023: Fed hiked aggressively; risk assets corrected but eventually recovered.
Lesson: Modern financial markets are highly resilient to policy shocks.
For gold, this means:
Current pullbacks are not signs of a trend collapse — they are position re-balancing phases.
Our task is to read price levels & liquidity instead of reacting emotionally to short-term news.
2️⃣ Technical View from H1
Price is ranging between ~4.19x and ~4.24x.
Volume Profile shows most volume at the centre; liquidity is thin at both edges — perfect zones for stop hunts and reversals.
A deeper Buy Zone POC lies around 4.16x.
If price breaks below 4.155 and closes beneath it, the short-term bullish structure becomes threatened.
With no clean breakout yet, I stick to a mean-reversion strategy:
Buy at the liquidity bottom
Sell at the supply top
Until the sideways structure breaks
3️⃣ Today’s Trading Plan
Only trade around the two edges:
✔ Buy Setup
Buy: 4.191–4.194
SL: 4.187
TP: 4.212 – 4.235 – 4.260 – 4.290
✔ Sell Setup
Sell: 4.237–4.240
SL: 4.245
TP: 4.220 – 4.202 – 4.180 – 4.155
No entries in the middle of the range to avoid getting “bitten from both sides.”
Keep risk at 1–2% per trade, do not widen SL.
If price breaks strongly beyond either boundary and stabilizes, I stop the range-trading strategy and wait for a new structure.
If you find this analysis useful, feel free to follow the TradingView account and share whether today you prefer BUY at the bottom or SELL at the POC zone. Short 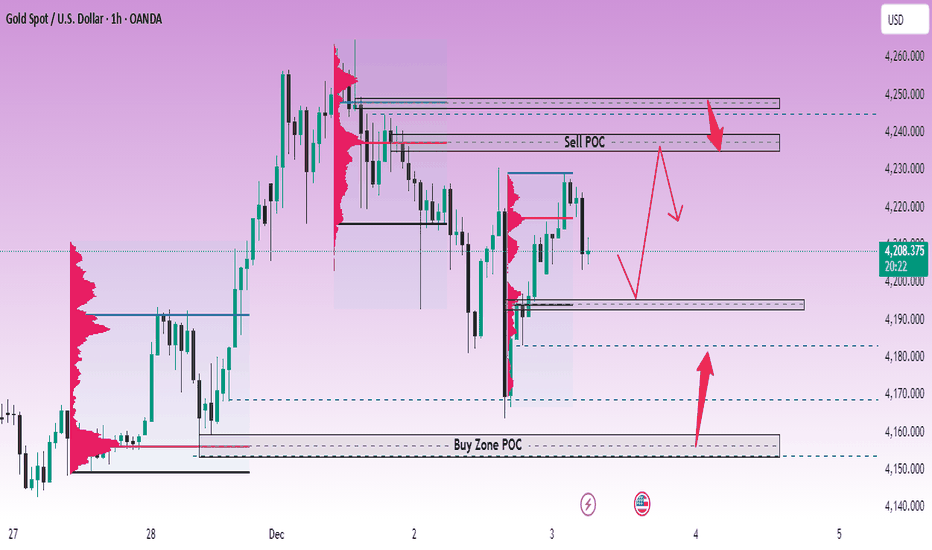
Long 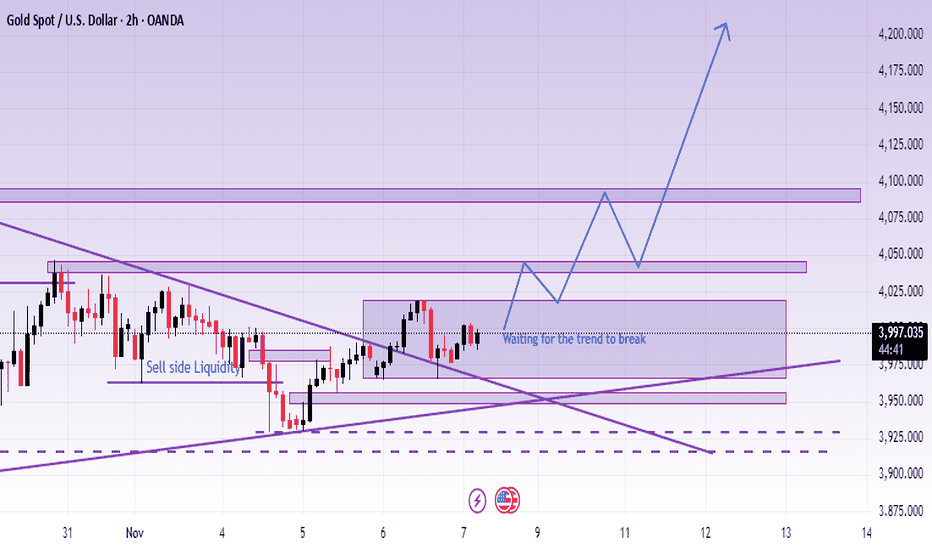
BTC Analysis: Daily Time Frame with Weekly Support at $42,828 anBTC Analysis: Daily Time Frame with Weekly Support at $42,828 and Weekly Resistance at $52,223
1. Current Price Action:
BTC is currently trading within a range between the weekly support at $42,828 and the weekly resistance at $52,223.
Within this range, the daily support is identified at $46,901, providing an additional level for traders to monitor.
2. Importance of Weekly Levels:
Weekly support and resistance levels play a significant role in identifying broader market sentiments and potential turning points.
Traders often look for confirmation of trend continuation or reversal around these levels.
3. Daily Support and Resistance:
The daily support at $46,901 and the daily resistance levels can provide intraday trading opportunities and finer entry and exit points within the broader weekly range.
4. 4-Hour Time Frame Support:
On the 4-hour time frame, additional support is observed at $50,288, further strengthening the significance of this level.
5. Trend Identification:
In the absence of a clear trend, BTC is likely experiencing consolidation within the broader range.
Traders should monitor price action for potential breakouts or breakdowns from the range to identify the next directional bias.
6. Trading Strategies:
Range Trading: Traders may consider buying near the weekly support of $42,828 and selling near the weekly resistance of $52,223 until a breakout or breakdown occurs.
Breakout Trading: A decisive breakout above $52,223 could signal a bullish continuation, while a breakdown below $42,828 could indicate further downside momentum.
Intraday Trading: Utilize the daily and 4-hour support and resistance levels for intraday trading strategies, such as scalping or swing trading.
7. Risk Management:
Implement strict risk management techniques, including stop-loss orders, to protect capital in case of adverse price movements.
Adjust position sizes according to the distance between entry and stop-loss levels relative to account size and risk tolerance.
8. Monitoring Catalysts:
Stay informed about fundamental and macroeconomic events, regulatory developments, and market sentiment surrounding BTC, as these factors can influence price action and trigger significant movements.
9. Summary:
BTC is currently trading within a range defined by the weekly support at $42,828 and the weekly resistance at $52,223.
Traders should monitor intraday support and resistance levels, such as the daily support at $46,901 and the 4-hour support at $50,288, for potential trading opportunities.
Utilize appropriate risk management strategies and stay informed about market catalysts to navigate the market effectively.
Gold Is Moving Sideways Waiting For The Break — 4590 Is The Key Over the weekend, the market continued reacting heavily to US–Iran headlines.
Trump stated that the US and Iran are getting closer to a new agreement, and he even canceled attending his son’s wedding to focus on the negotiations. This helped ease tensions around the Strait of Hormuz and pushed oil prices lower after breaking a major resistance zone.
However, this morning Trump also mentioned that the agreement “does not need to be signed too quickly,” showing that the current strategy still seems to be a mix of pressure and de-escalation in order to prevent oil prices from overheating and pushing inflation higher again.
Most importantly:
So far, there has still been no official confirmation from Iran.
Personal View
Gold is currently forming a potential inverse head and shoulders pattern, with the key neckline located around the 4590 area.
However, because the market opened with a gap this morning, I expect gold to continue moving sideways within the current H3 candle range before any clearer breakout appears.
Personal Trading Plan:
Still prioritizing SELL positions overall
First SELL zone to watch: 458X
If price clearly breaks above 4590 → I will stop prioritizing SELL setups
Key SELL reaction zones:
4620 | 4650 | 4660
Key BUY reaction zones:
4500 | 4484 | 4462 | 4420–4414
For short-term scalp traders, you can also watch reactions around:
453X | 4540
These areas could provide short-term BUY reaction opportunities during intraday trading.
Main Idea
The market is still trading heavily based on US–Iran headlines
4590 remains the key neckline level
Until a confirmed breakout appears → range trading and reaction setups remain the priority
“In the current market, headlines are stronger than technicals.”
What do you think?
Will gold break above 4590 and complete the inverse head and shoulders pattern — or is this just another rebound before SELL pressure returns? 🔥 Short 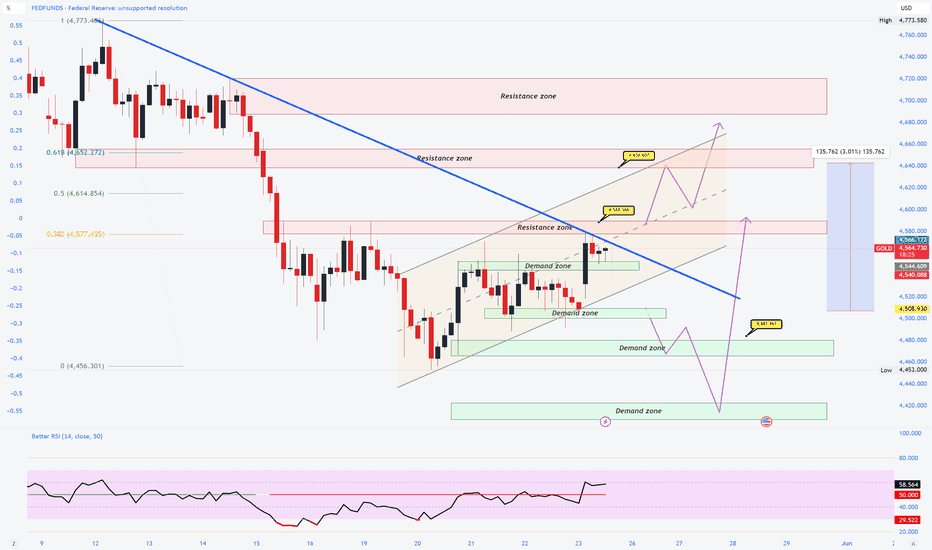
SENSEX Intraday Trading Plan: Thursday, 14-May-2026
The market context in image_cb5bfd.png reveals a confirmed downtrend, with a series of lower highs and lower lows dominating the 15-minute timeframe. A major breakdown occurred on May 11th, and despite some corrective bounces, selling pressure has been relentless. We are now approaching a critical psychological edge, making today's session pivotal for either trend continuation or a deeper relief rally. Our entire decision-making process will revolve around how price reacts to the orange Opening Support/Resistance zone (74,358 - 74,668.74) and the key horizontal lines from previous breakdowns.
🔍 Concise Recap: Previous Session vs. Actual
Our previous plan anticipated a weak bias and favored selling on rallies.
• Plan Thesis: The primary outlook was a range-bound or weak session, prioritizing shorts from near the previous session recap resistance of 75,050, with a target test of 74,358.
• Actual Movement: SENSEX followed the weakest possible trajectory. After a minor gap down, it immediately tested and broke through the intermediate support. The session spent significant time oscillating around the bottom end of the range, effectively respecting the key zones. It closed weak near the lows, setting up a negative tone for today.
• Verdict: All key levels and the primary downtrend scenario played out with precision. Price did test the major value area (Buyer’s Support) near 73,845 as we drifted lower.
🧠 Market Context & Major Structure Levels
Referencing the chart in image_cb5bfd.png, we are at a significant juncture. The market is attempting to define a new floor after a multi-day sell-off from 77,200+.
The key levels to memorize and plot on your terminal:
🛑 Key Intraday Resistance 2 (Profit Booking Zone): 75,369.00 (Base of a previous breakdown).
🚧 Key Intraday Resistance 1: 75,050.00 (Last significant minor breakdown).
🔄 Opening Support/Resistance Zone: 74,358 - 74,668.74 (This is our current PIVOT ZONE).
🛡️ Buyer’s Support (Major Demand): 73,845.00 (Critical level; failure here triggers significant selling panic).
The market is coiled, and a flat opening will likely lead to range trading, while gaps will trap overnight positions.
🚀 Scenario 1: Gap Up Opening (Above 74,700)
A gap up would immediately take us above our critical 74,668.74 pivot line, creating a "Trap" for recent shorts and potentially triggering a significant short-covering rally.
Key Resistance Levels:
• Resistance 1: 75,050.00 (Critical)
• Resistance 2: 75,369.00 (Major Profit Booking)
Key Support Levels:
• Support 1: 74,668.74 (Flipped Resistance)
• Support 2: 74,500 (Psychological)
Market Expectation: In a gap-up scenario after a downtrend, we expect initial volatility as shorts are squeezed. Price is expected to push towards the first major target of 75,050, which is where we will find sellers who missed the previous breakdown. Bulls will be eager to buy dips, so we must watch for a successful support flip at the previous pivot.
Actionable Approach:
• Wait for the Retest: Do not jump into longs on the opening tick. Wait for the market to complete its initial panic surge and test the 74,668.74 level.
• Confirmation Signal: Look for a bullish rejection candle (e.g., a hammer or bullish engulfing) forming exactly on or slightly above 74,668.74. This confirms the previous ceiling is now a floor.
• Execution Logic:
• Entry: Successful bounce from 74,668.74.
• SL: Below 74,500 (giving it room for a wash-out).
• Target: First partial booking at 75,000, with major target at 75,050. Beyond this, we can trailing SL for 75,369.
↔️ Scenario 2: Flat Opening (Within ±100 pts, ~74,600)
A flat opening places us squarely inside our core pivot range and suggests that the 'Undecided' state from yesterday continues.
Key Resistance Levels:
• Resistance 1: 74,668.74 (Pivot top)
• Resistance 2: 74,750 (Intermediate)
Key Support Levels:
• Support 1: 74,450 (Intraday floor)
• Support 2: 74,358 (Pivot bottom)
Market Expectation: Range trading. Expect choppy, undecided price action with price oscillating between 74,358 and 74,668.74. Breakout hunters will be frustrated. Theta decay will punish options buyers. This is a day for scalping, not multi-hour trend-following trades. We prioritize waiting for a clear range breakdown/breakout on volume.
Actionable Approach:
• Wait for a Range to Form: spend the first 30-45 minutes mapping the intraday support and resistance within this range.
• Confirmation Signal:
• Range Play: If the range holds, look for bearish price action signals near 74,660 (Pivot top) to go short, or bullish signals near 74,360 (Pivot bottom) to go long, with small targets and tight SLs.
• Breakout Play (Higher Probability): Wait for a clear 15-minute candle close either above 74,750 (to trigger longs - see Scenario 1 logic) or below 74,350 (to trigger shorts - see Scenario 3 logic).
• Execution Logic:
• Entry: Successful breakout/breakdown of the defined 15-minute range high/low.
• SL: Tight, on the opposite side of the range boundary.
• Target: Next major level (either 75,050 for longs or 73,845 for shorts).
📉 Scenario 3: Gap Down Opening (Below 74,300)
A gap down, opening below our major pivot zone support, confirms the immediate continuation of the downtrend and places significant pressure on remaining long positions.
Key Resistance Levels:
• Resistance 1: 74,358 (Flipped Support)
• Resistance 2: 74,450 (Minor)
Key Support Levels:
• Support 1: 74,100 (Intermediate psychological)
• Support 2: 73,845.00 (Buyer’s Support Zone - critical major demand)
Market Expectation: Panic selling. Longs are trapped and will rush to sell, creating a "flush" on the opening. Trend-followers and bears will add to their positions. Price is expected to test intermediate levels quickly. The primary destination for this wave of selling is the major value zone and previous value area: Buyer’s Support at 73,845. A brief panic spike could overshoot this level. Once price reaches this major zone, we may finally see significant profit booking and a potential relief attempt. Counter-trend longs are only viable on deep panic.
Actionable Approach:
• Wait for the Panic to Cool: Do not jump into shorts immediately on the opening panic. Let the initial wash-out complete.
• Confirmation Signal (Trend Trade): The safest trade is a Sell on Rise. Wait for a weak, low-volume pullback (re-bounce) towards the flipped 74,358 resistance. Look for a strong bearish rejection candle there (e.g., an inverted hammer or a strong bearish engulfing on a lower-high formation).
• Confirmation Signal (Deep Panic Play): If price slams directly into 73,845 without pausing, look for massive volume and a rapid 'V-shaped' recovery (exhaustion pattern) or a consolidation base and successful break to the upside from the green support zone.
• Execution Logic:
• Entry: Low breakdown of a rejection candle near 74,358 (Short). Or, on deep panic, long near 73,845 on defined reversal signals.
• SL: Above 74,400 (for Shorts). Below 73,750 (for deep panic Longs).
• Target: 74,100 first, with primary target at 73,845. Long targets would be back to 74,350.
🛡️ Risk Management Shield: Options Trading Specifics
Trading SENSEX, especially on high volatility days, requires strict discipline:
Position Sizing: Because of the wide point ranges (a 100-pt gap is small on SENSEX), you MUST reduce your standard quantity to 30-50% of normal. If you usually trade 10 lots, move to 3 or 4. High India VIX means inflated premiums; a small swing can decimate an overleveraged account.
Stop-Loss Discipline: No mental stop-losses. Every single trade must have a physical SL order placed in the system immediately after entry. Never "give it a bit more room." If the level is broken, the logic is dead. Preserve your capital first.
Avoid Overtrading: Pick ONE scenario. If it doesn't play out, sit on cash. The desire to "do something" is your greatest enemy on choppy or directional breakdown days. Stick to max 2-3 trades.
Confirmation vs. Prediction: We do not predict. We do not say "It has fallen enough, it must go up." Wait for the chart to show a Higher High before going Long, or a Lower Low before going Short. Wait for the candle to close.
Managing Volatility and Premiums: SENSEX options have higher delta and gamma due to the higher index value. Buying OTM (Out-of-the-Money) puts you at extreme risk from rapid theta decay (especially in Scenario 2 flat opens). Prioritize deep ITM (In-the-Money) or at-the-money (ATM) spreads to reduce the impact of theta.
✨ Summary & Conclusion
Structural Context: We are in a dominant multi-day downtrend approaching massive structural support at Buyer’s Support: 73,845.
Directional Bias: Tactically neutral until a breakout/breakdown from the pivot range occurs. We must remain watchful for a relief bounce near major value.
Critical Pivots to Watch:
• Major Ceiling (Sell Zone): 75,050 - 75,369.
• Current Pivot: 74,358 - 74,668.74. A break on either side will determine the day's trend.
• Major Floor (Buy Zone): 73,845.
Final Trading Mindset: Patience is your most profitable skill today. Let the market prove its direction. Plan the trade, then trade the plan. 📘📈
📜 Disclaimer
"I am not a SEBI-registered analyst. This is for educational purposes only and should not be considered financial advice. All trading and investment decisions involve significant risk. Please consult a certified financial advisor before making any investment decisions."  Short
Short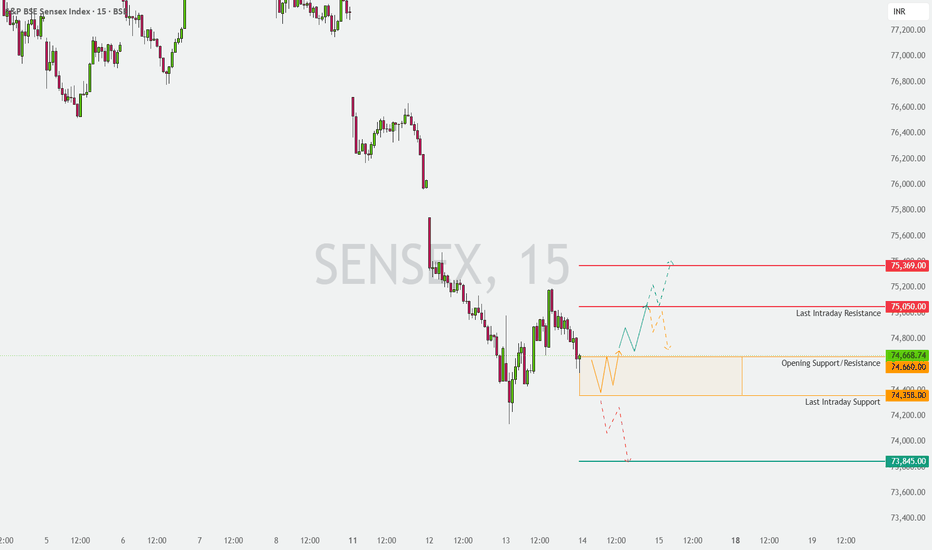
Nifty : Intraday Trading Plan, 14-May-2026
Welcome to today's detailed strategic analysis. The purpose of this document is not to provide blind signals, but to equip you with a high-probability decision-making framework based on market structure and price action. By defining key levels and scenarios in advance, we replace emotional reactions with calculated execution.
🔍 Concise Recap: Previous Session vs. Actual
Let's start by analyzing yesterday's performance to build a strong foundation for today.
Plan Thesis: Yesterday, we identified a crucial structural breakdown and a strong downtrend. Our plan prioritized a "Sell on Rise" strategy at resistances, specifically targeting the breakdown from previous consolidations.
Actual Movement: Nifty followed our bearish thesis precisely. The key intraday resistance levels we defined were respected perfectly. After failure to move higher, selling pressure intensified.
Verdict: All key levels and the primary downtrend scenario played out with high technical precision. Our decision to remain biased against the trend paid off. We closed the session weak, near the lows, setting up a negative tone for today. This leads us to the current setup in image_cb7263.png.
🧠 Market Context & Current Setup
Referencing the 15-minute chart in image_cb7263.png, we have a clear, multi-day downtrend that is decelerating and attempting to find a floor. The massive sell-off from 24,000+ has paused, and a complex '底' (bottom) pattern or range is forming.
Our key structural levels are clearly defined:
Profit Booking Zone (Resistance): 23,690 - 23,721 (Crucial, as it was the base of a previous breakdown).
Opening/Last Intraday Resistance Zone: 23,487 - 23,543 (A critical 'no-man's land' where price has recently failed).
Current Pivot/Last Intraday Support: 23,331.00 (This is the most critical immediate level to watch).
Buyer's Support (Major Demand): 23,061 - 23,121 (A previous major value area, key to long-term stability).
Let's break down how to handle today's opening.
🚀 Scenario 1: Gap Up Opening (Above 23,550)
A gap up would immediately take us above our critical 23,487-23,543 resistance zone, changing the immediate market bias and potentially triggering a significant short-covering rally.
Key Resistance Levels:
• Resistance 1: 23,600 (Psychological)
• Resistance 2: 23,690 - 23,721 (Profit Booking Zone - major target)
Key Support Levels:
• Support 1: 23,543 (Previous Resistance zone, now flipped)
• Support 2: 23,487 (Bottom of the flipped zone)
Market Expectation: A gap of this magnitude after a downtrend will trap all recent short sellers. This creates automatic demand as they rush to cover. Price is expected to push aggressively toward the Profit Booking Zone (23,690 - 23,721). Traders will be eagerly waiting for dips to enter long.
Actionable Approach:
• Wait for Confirmation: Do not immediately chase the opening tick. Wait for the first 5-minute candle to close. A strong, full-bodied bullish candle that respects the 23,543 support confirms short-covering.
• Confirmation Signal: Watch for a successful retest of 23,543. If price dips and bounces with strong bullish price action (e.g., a bullish engulfing or morning star pattern), it confirms the support flip.
• Execution Logic:
• Trigger: Successful retest of 23,543 or breakout of initial 5-minute range high.
• Entry: Near 23,543.
• Stop Loss (SL): Below 23,487. A break here would suggest the gap was a bull trap.
• Target: First major target at 23,690, with potential extension to 23,721. This is where we must start booking partial profits, as shown by the red box in image_cb7263.png.
↔️ Scenario 2: Flat Opening (Within ±100 pts, ~23,430)
A flat opening places us squarely between our critical levels, leading to range-bound price action. The market is effectively 'undecided'.
Key Resistance Levels:
• Resistance 1: 23,487 (Bottom of the resistance zone)
• Resistance 2: 23,543 (Top of the resistance zone)
Key Support Levels:
• Support 1: 23,331.00 (Immediate support)
• Support 2: 23,280 (Previous local support)
Market Expectation: Range trading. We have no clear directional bias. The market is looking for clues. Price will likely oscillate between the 23,331 support and the 23,487 resistance. Breakout hunters will be frustrated. Theta decay will punish options buyers. This is a day for scalping or waiting for a breakout.
Actionable Approach:
• Wait for a Range to Form: Spend the first hour mapping the intraday support and resistance within this broader range. For example, 23,350 to 23,450.
• Confirmation Signal:
• Range Trade: If the range holds, look for bearish price action signals near 23,487 to go short, and bullish price action signals near 23,331 to go long, with small targets and tight SLs.
• Breakout Trade (Higher Probability): Wait for a clear break and sustain (15-min candle close) either above 23,543 (Bullish - see Scenario 1 logic) or below 23,331 (Bearish - see Scenario 3 logic).
• Execution Logic (Range Example):
• Trigger: A strong 15-minute rejection candle (e.g., an inverted hammer or bearish engulfing) at 23,480.
• Entry: On the low breakdown of the rejection candle.
• Stop Loss (SL): Tight, above 23,490.
• Target: 23,350-23,331 (Support).
📉 Scenario 3: Gap Down Opening (Below 23,330)
A gap down, opening below the crucial 23,331 support, confirms the immediate continuation of the downtrend and places significant pressure on the remaining long positions.
Key Resistance Levels:
• Resistance 1: 23,331.00 (Major flipped support)
• Resistance 2: 23,380 (Flipped minor support)
Key Support Levels:
• Support 1: 23,200 (Intermediate psychological support)
• Support 2: 23,061 - 23,121 (Buyer's Support Zone - critical major demand, as seen in image_cb7263.png)
Market Expectation: Strong panic among long holders and aggressive short-selling by trend followers. We have a confirmed breakdown. The market will test intermediate levels quickly. The ultimate target for this wave of selling is the Buyer's Support Zone (23,061 - 23,121). A brief panic spike could overshoot this level. After reaching this major zone, we may finally see significant profit booking and a potential bottom.
Actionable Approach:
• Wait for Panic to Cool: Do not jump into short trades on the opening panic flush. Let the market complete its initial wash-out.
• Confirmation Signal (Pullback Entry): The highest probability trade is a Sell on Rise. Wait for a weak, low-volume pullback (re-bounce) towards the flipped 23,331 resistance or the 23,380 level.
• Confirmation Signal (Breakout Entry): Alternatively, if price doesn't pullback, wait for a consolidation range to form and break to the downside on high volume (a bearish flag pattern).
• Execution Logic (Pullback example):
• Trigger: Weak bounce to 23,331, followed by a strong bearish rejection signal (e.g., a bearish engulfing on a lower-high formation).
• Entry: On the low breakdown of the rejection candle.
• Stop Loss (SL): Tight, above 23,360.
• Target: First target at 23,200. Major profit-booking target near 23,100. This green zone in image_cb7263.png must be watched for potential reversal signs, but until a structural breakout occurs, we must respect the downtrend and take short profits.
🛡️ Risk Management Shield: Options Trading Specifics
High volatility days make risk management paramount. Ignore these at your peril.
Position Sizing: Your position size should be your #1 risk control. In highly volatile or range-bound markets, reduce your standard position size by 50-70%. Aim for consistent, smaller gains over trying to hit "jackpots." Ensure that no single trade losses exceed 2-3% of your capital.
Stop-Loss Discipline: A stop-loss is your emergency exit. Once set, never remove it, move it in favor of a losing trade, or replace it with a "mental SL." System SLs are non-negotiable.
Confirmation vs. Prediction: We do not predict. We do not say "The market will go up." We wait for a signal. Confirmation is key. Wait for price action to confirm support or resistance before pulling the trigger. Example: A rejection candle at 23,690 is confirmation; guessing it's resistance is prediction.
Avoiding Overtrading: Define your setup clearly (e.g., retest of support). If that setup doesn't appear, do not trade. Overtrading is caused by boredom and a desire for action. Cash is a perfectly valid position. Limit your intraday trades to a maximum of 2-3 high-probability setups.
Managing Volatility and Premiums: High volatility means high option premiums (IV). Do not buy OTM (Out-of-the-Money) options, as they decay rapidly. Prioritize ATM (At-the-Money) or slightly ITM (In-the-Money) calls/puts for better delta. Spreads (e.g., Bull Call Spread or Bear Put Spread) are excellent for volatility, as they have predefined risk/reward and reduce the impact of theta decay.
Respecting the Trend: The trend is currently BEARISH. Counter-trend trades (like buying at supports) should be taken with maximum caution, strict SLs, and minimal capital. High-probability trades remain aligned with the trend until a clear structural breakout occurs.
✨ Summary & Conclusion
Structural Context: We are in a confirmed downtrend, approaching massive long-term support at 23,061-23,121.
Directional Bias: Tactically neutral but structurally bearish. We wait for confirmation.
Pivot Levels:
• Major Ceiling: 23,690 - 23,721 (Sell zone).
• Intermediate Key Resistance: 23,487 - 23,543 (Flipped resistance).
• Current Pivot: 23,331 (Support). A break of this level confirms continuation of downtrend.
Mindset: Plan your trades in advance. Trade with precision, not hope. Let the setups come to you. If you don't understand the price action, don't trade. Preserve your capital for tomorrow.
Good luck, and trade safe!
📜 Disclaimer
"I am not a SEBI-registered analyst. This is for educational purposes only and should not be considered financial advice. All trading and investment decisions should be made based on your own research and risk tolerance. Please consult a certified financial advisor before making any investment or trading decisions."  Short
Short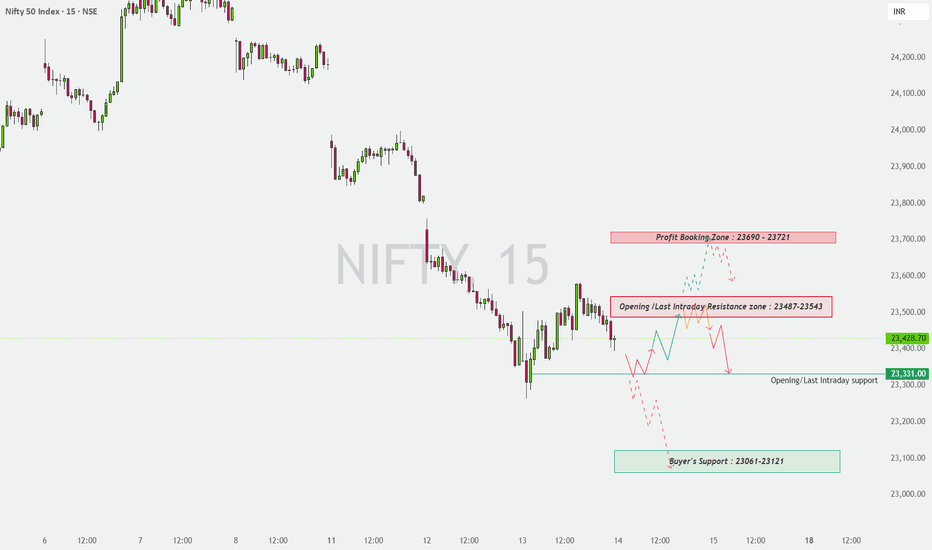
Gold Analysis & Trading Strategy | May 11✅ 4H Trend Analysis
Gold has gradually shifted from a previous one-sided downtrend into a corrective phase. After forming a short-term bottom around 4500, price rebounded and is now showing higher lows, indicating strengthening support below.
From a moving average perspective, MA5 has crossed above MA10, suggesting improving short-term momentum. Meanwhile, MA20 is flattening, signaling that the medium-term trend is transitioning from bearish to consolidation.
At this stage, the 4H structure is best described as range-bound with a bullish bias, but a true trend reversal has not yet been confirmed.
✅ 1H Trend Analysis
On the 1-hour chart, the market is clearly in a consolidation phase. After pushing up to around 4760, price pulled back and is now fluctuating within the 4710–4740 range. Highs are no longer rising, while the 4700 level has repeatedly acted as support, forming a sideways structure.
The moving averages (MA5, MA10, MA20) are tightly clustered, indicating no clear short-term directional trend. At the same time, MACD momentum is weakening, with frequent shifts between bullish and bearish signals and a lack of follow-through — a typical sign of consolidation.
In the short term, the market is waiting for a directional breakout. Until a valid breakout occurs, the strategy should remain range trading.
📊 Key Structure Zones
● Upper Resistance: 4760 (previous high)
● Mid-zone: 4710–4720
● Lower Support: 4700 / 4660
🔴 Resistance Levels
● 4740–4760 (strong short-term resistance zone)
● 4790 (higher structural resistance)
🟢 Support Levels
● 4700 (key short-term support)
● 4660 (structural support)
● 4630 (deeper defensive level)
✅ Trading Strategy Reference
🔰 Sell Strategy (Range High Short)
👉 Entry: 4745 – 4760
🎯 Targets: 4710 → 4700 → 4660
📍 Logic:
● Strong resistance at previous highs
● Weakening momentum on the 1H chart
● Range-bound conditions favor selling at highs
🔰 Buy Strategy (Range Low Long)
👉 Entry: 4690 – 4700
🎯 Targets: 4720 → 4740
📍 Logic:
● Strong support at the lower boundary
● Suitable for short-term range trading
● Requires quick entry and exit
⚠️ Trend Outlook
👉 Break above 4760: Bullish continuation → targets 4790 / 4820
👉 Break below 4700: Bearish shift → targets 4660 / 4600
👉 If price remains within 4700–4760: Market stays in consolidation Protect your capital and make small profitsGold hit new highs and then pulled back sharply this week. Many of you probably got trapped chasing highs or sold in a panic, feeling lost and uncertain. So how should we trade next week? The core rule is simple: don’t be greedy. Protect your wallet while taking small profits. Don’t aim to get rich overnight.
Next week, gold will most likely trade sideways in a range. It won’t rally nonstop, nor will it keep falling. The market is deeply divided: on one hand, investors believe gold will rise in the long term and are unwilling to sell; on the other, they fear sticky inflation and a hawkish Fed, so they dare not buy more. Both bulls and bears are waiting on the sidelines, so a one-sided trend is unlikely.
Avoid these mistakes:
1.Don’t blindly chase highs just because you hear “gold will break above 5000”. Gold is now fluctuating at high levels, and chasing highs will most likely leave you trapped.
2.Don’t try to “buy the dip”. Even if gold falls a little, it’s not the bottom. In a ranging market, dip-buying often leads to getting stuck halfway and deeper losses.
3.Take profits when you’re ahead, no matter how much you earn. For example, if you invest $1,000 and make $80–$100 profit, it’s time to sell. Greed will only erase your gains or even cost you your principal.
4.If gold suddenly breaks below 4700 (around this week’s low) or surges above 4800 next week, don’t follow the crowd immediately. Wait and observe until the trend is clear. It’s better to miss a move than to make a wrong trade.
We trade gold simply to earn extra income and live a better life. Don’t let market volatility throw you off balance. We avoid high risks and focus on safe range trading. Protecting your principal is the top priority — only with capital can you make more profits.
📌 I share my trading strategies every day. Gold may range before next break.Gold May Stay Range-Bound Into FOMC Before the Next Break
Gold is approaching a key decision zone, but today’s rate meeting may keep price trapped in a holding pattern first. The Fed is widely expected to leave rates unchanged, so the real driver for gold may come from the tone of the statement, projections, and Powell’s guidance rather than the decision itself.
Fundamental backdrop
The rate outcome is almost fully priced in, which means the market is now focused on the Fed’s path forward. Recent Fed communication has emphasized caution, data dependence, and no preset course for further adjustments, so traders are likely waiting for a clearer signal before committing to a larger directional move.
That keeps gold in a sensitive position. Safe-haven demand can still offer background support, but if the Fed avoids sounding dovish, the Dollar may stay firm enough to prevent a clean upside breakout in gold. This is why a sideways phase ahead of the meeting still makes sense.
Technical structure on H3
Overall structure
On the H3 chart, gold remains under broader downside pressure after failing to recover above the upper sell FVG. Price is still trading below the broken short-term structure and below the descending guide from the recent swing high, which keeps the market leaning defensive.
At the same time, the selloff has slowed as price approaches the weekly low and the nearby liquidity base. That is a sign the market may need more information before choosing its next expansion leg.
4,990 – 4,967: Weekly low support zone
The most important area right now is the 4,990 – 4,967 support region around the weekly low.
This is the first key line buyers need to defend if they want to keep gold in consolidation ahead of the news. As long as price remains above this zone, the market can still rotate sideways and build a temporary base.
A clean break below this area would be more meaningful because it would suggest sellers are no longer waiting for the Fed and are already pushing for a deeper correction.
4,910 – 4,850: Liquidity and strong buy zone
Below the current market, the next major demand area sits around 4,910 – 4,850.
This zone is important because it combines visible liquidity with a stronger reaction area from the broader structure. If the weekly low fails, this becomes the next region where gold may try to stabilize and attract dip buyers again.
4,680 – 4,700: Rejection region
If selling pressure accelerates after the Fed, the deeper downside focus shifts toward the 4,680 – 4,700 rejection region.
This is the larger support shelf on the chart and the area where a stronger medium-term reaction would become more likely.
5,070 – 5,090: Sell FVG resistance
On the upside, the nearest resistance remains the 5,070 – 5,090 sell FVG.
This is still the key cap for any short-term recovery. If gold rebounds before or after the meeting but fails inside this zone, the move would likely remain corrective rather than the start of a stronger bullish reversal.
What order flow is suggesting
Order flow currently suggests hesitation rather than commitment.
So for now:
sellers still hold the broader structure below the sell FVG
buyers are trying to defend the weekly low and nearby liquidity zone
and the market may continue rotating sideways until the Fed provides a clearer catalyst
This is the kind of structure that often appears before a news-driven expansion move.
Trading scenarios
Scenario 1: Sideways trading continues into FOMC
If gold continues to hold above 4,967 but cannot reclaim 5,070 – 5,090, price may remain trapped in a consolidation range before the meeting outcome is digested.
Entry: range trading between support and resistance only on confirmation
SL: outside the range extremes
TP: middle of the range / opposite edge depending on intraday reaction
Scenario 2: Rebound into sell zone, then downside resumes
If price rebounds toward 5,070 – 5,090 but fails to break higher, sellers may re-enter from the FVG resistance.
Entry: 5,070 – 5,090 on bearish rejection
SL: above 5,110
TP1: 5,000
TP2: 4,967
TP3: 4,910 – 4,850
Scenario 3: Weekly low breaks after the Fed
If gold closes decisively below 4,967, the broader correction may extend into the next liquidity layer.
Entry: below 4,967 on confirmed breakdown
SL: above the broken support
TP1: 4,910
TP2: 4,850
TP3: 4,680 – 4,700
Key levels to watch
5,070 – 5,090 → sell FVG resistance
5,000 – 4,967 → weekly low support pivot
4,910 – 4,850 → liquidity and strong buy zone
4,680 – 4,700 → deeper rejection region
Conclusion
Gold still looks capable of trading sideways in the short term as the market waits for today’s FOMC decision and, more importantly, the Fed’s guidance. The rate hold is largely expected, so price may stay range-bound first before reacting to the statement and Powell’s tone.
For now, 5,070 – 5,090 remains the key sell zone, while 4,967 is the support that buyers need to protect. If that floor breaks, gold may open the way toward the deeper liquidity zones below.
Follow Lana for more XAUUSD trading ideas and clear technical setups. Short 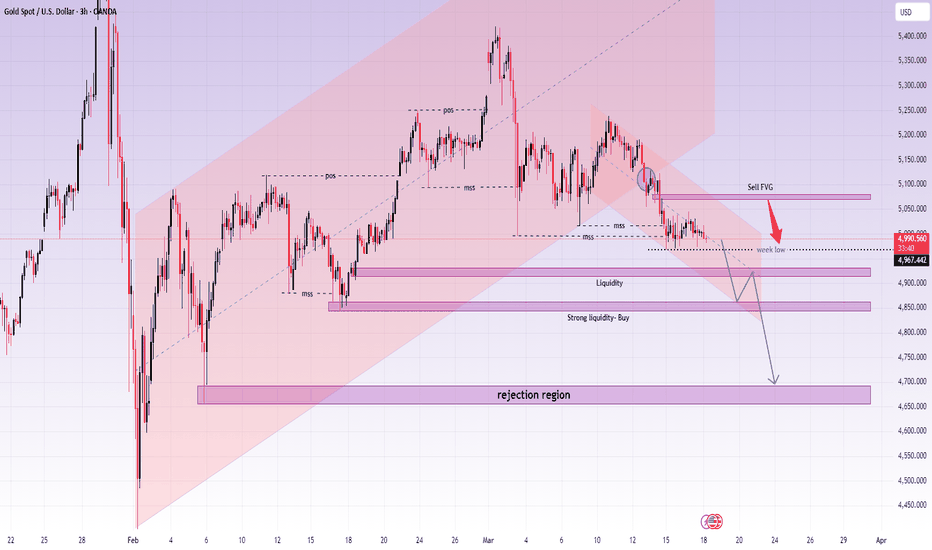
 Long
Long
 Long
Long